
For Investors, Analysts & Traders
The Bull Market Is Almost Over. The Next Move Isn’t.
Make sense of liquidity, macro cycles, and market structure—before the crowd.
Navigate volatility, spot asymmetry, and plan your next moves with data‑driven clarity.
No lock‑in. Cancel anytime before your next billing. Educational content—no “signals.”
Join The Game Of Liquidity
Find out what market plays you must make in order to profit AND stay safe in the next decade.
Membership renews automatically.
Cancel any time - Risk Free.
OG STATUS
After your first 6 months in Game Of Liquidity Premium, you become an OG.
You’ll receive a special badge on Discord, and your subscription will be discounted by 20% FOR LIFE.
Track Record
See my past predictions and WHY they came to be true.
Record #1
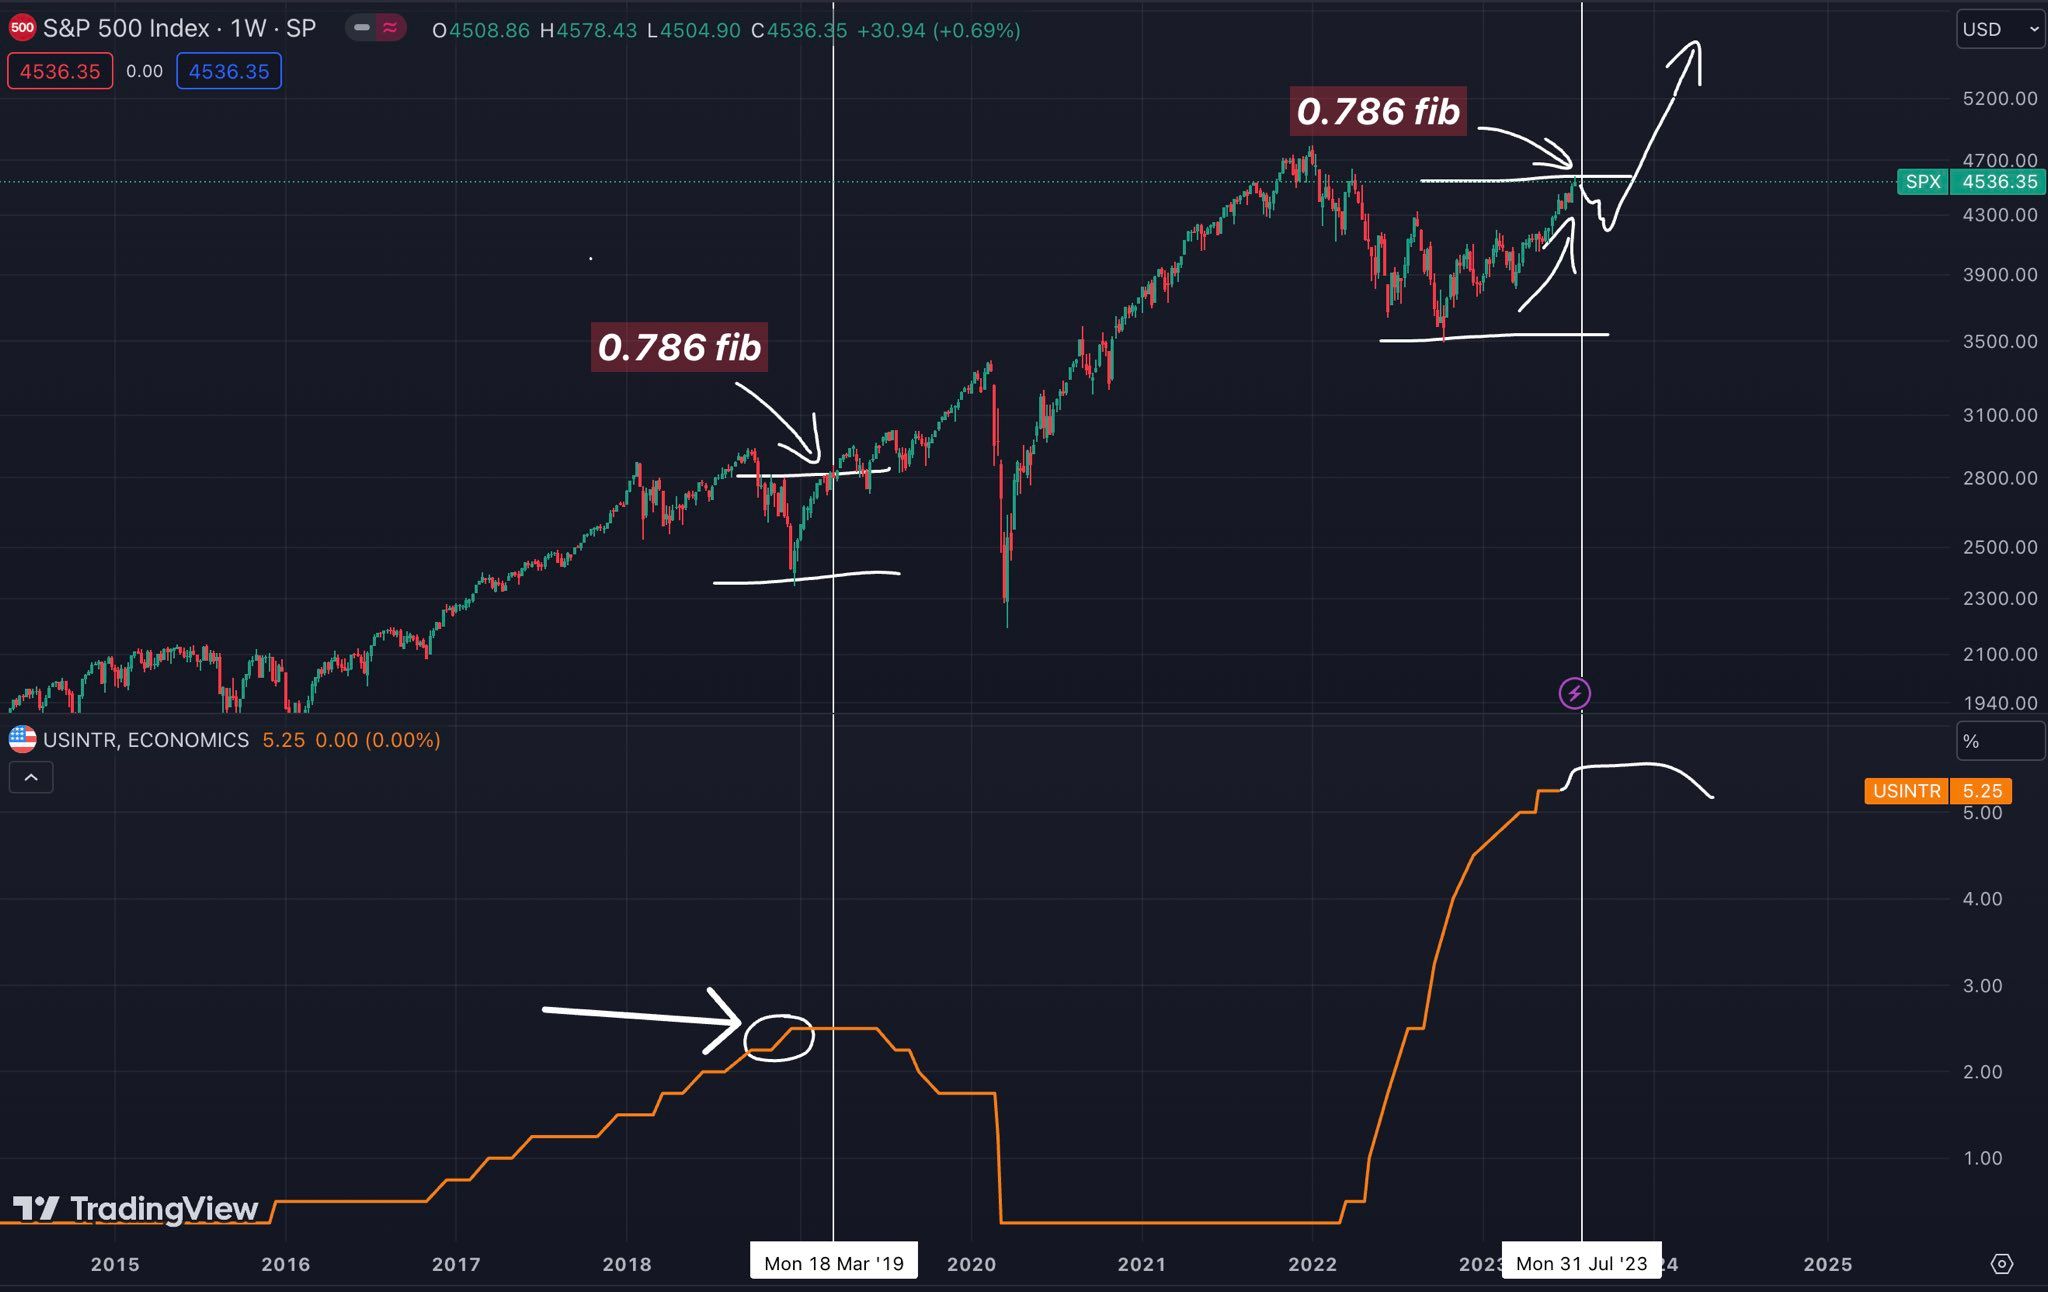
Date of Forecast: July 22, 2023
Details: "Predicted that the S&P 500 Index (SPX) reaching the 0.786 Fibonacci level would precede a significant rally in Bitcoin after a lag of 1-3 months."
Outcome: "SPX hit the 0.786 level, and Bitcoin followed with a significant upward movement, reflecting a similar pattern from 2019.
Record #2
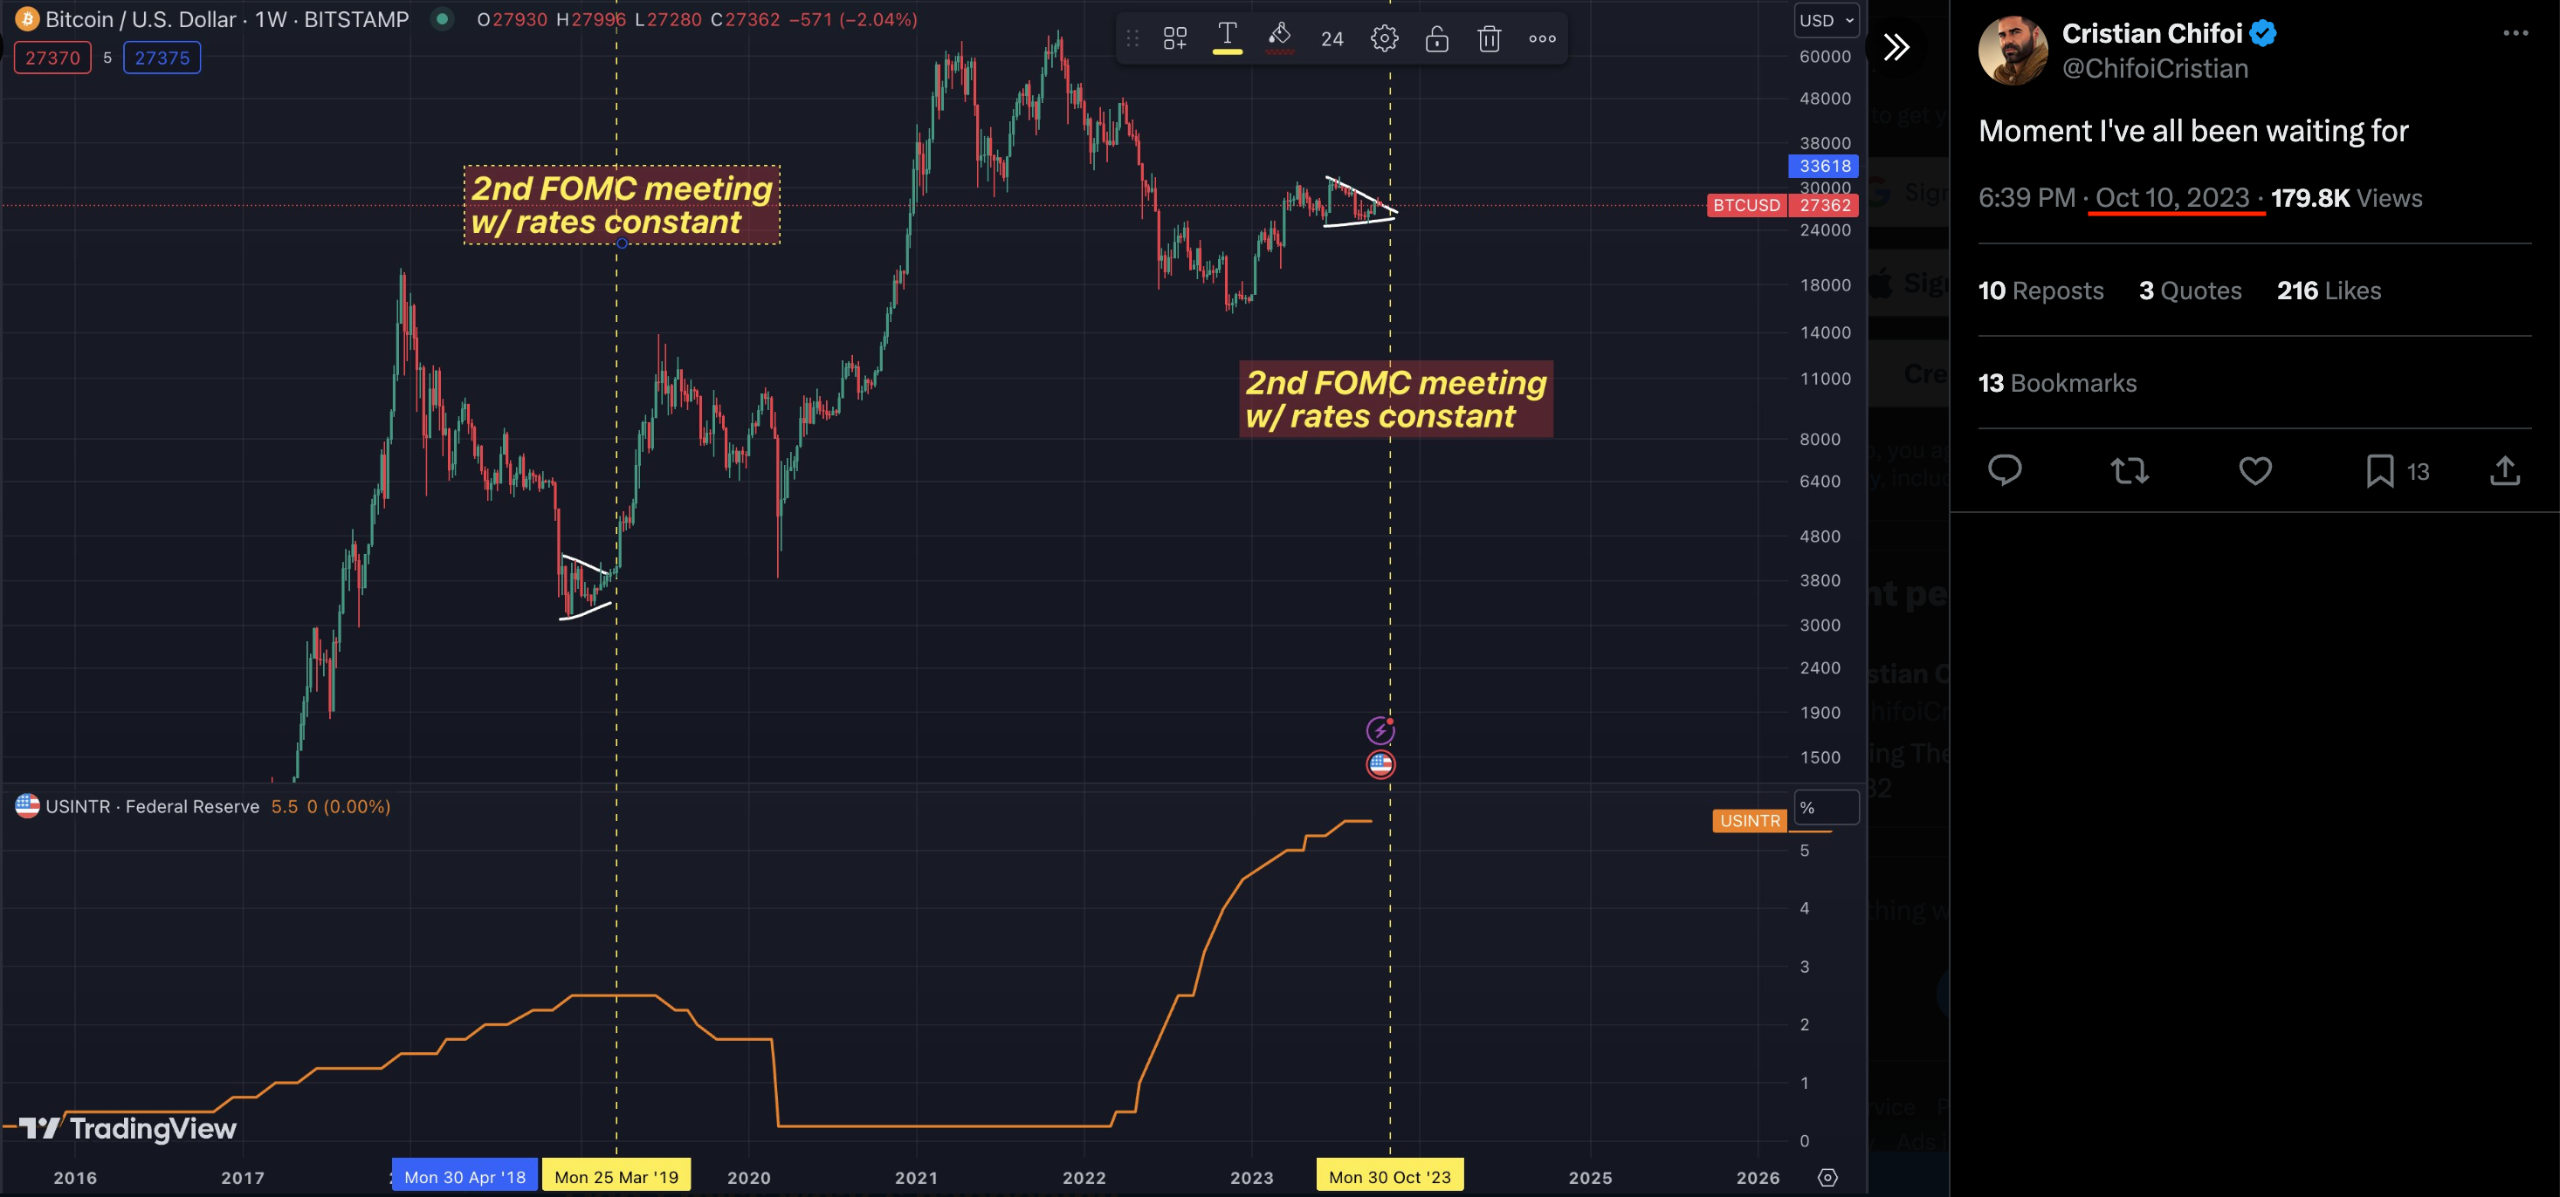
Date of Forecast: October 10, 2023
Details: "Forecasted that the 2nd FOMC meeting with constant rates would lead to Bitcoin reaching a new all-time high (ATH) based on historical patterns observed in 2019."
Outcome: "Following the forecast, Bitcoin reached a new ATH, validating the projected market behavior."
Record #3
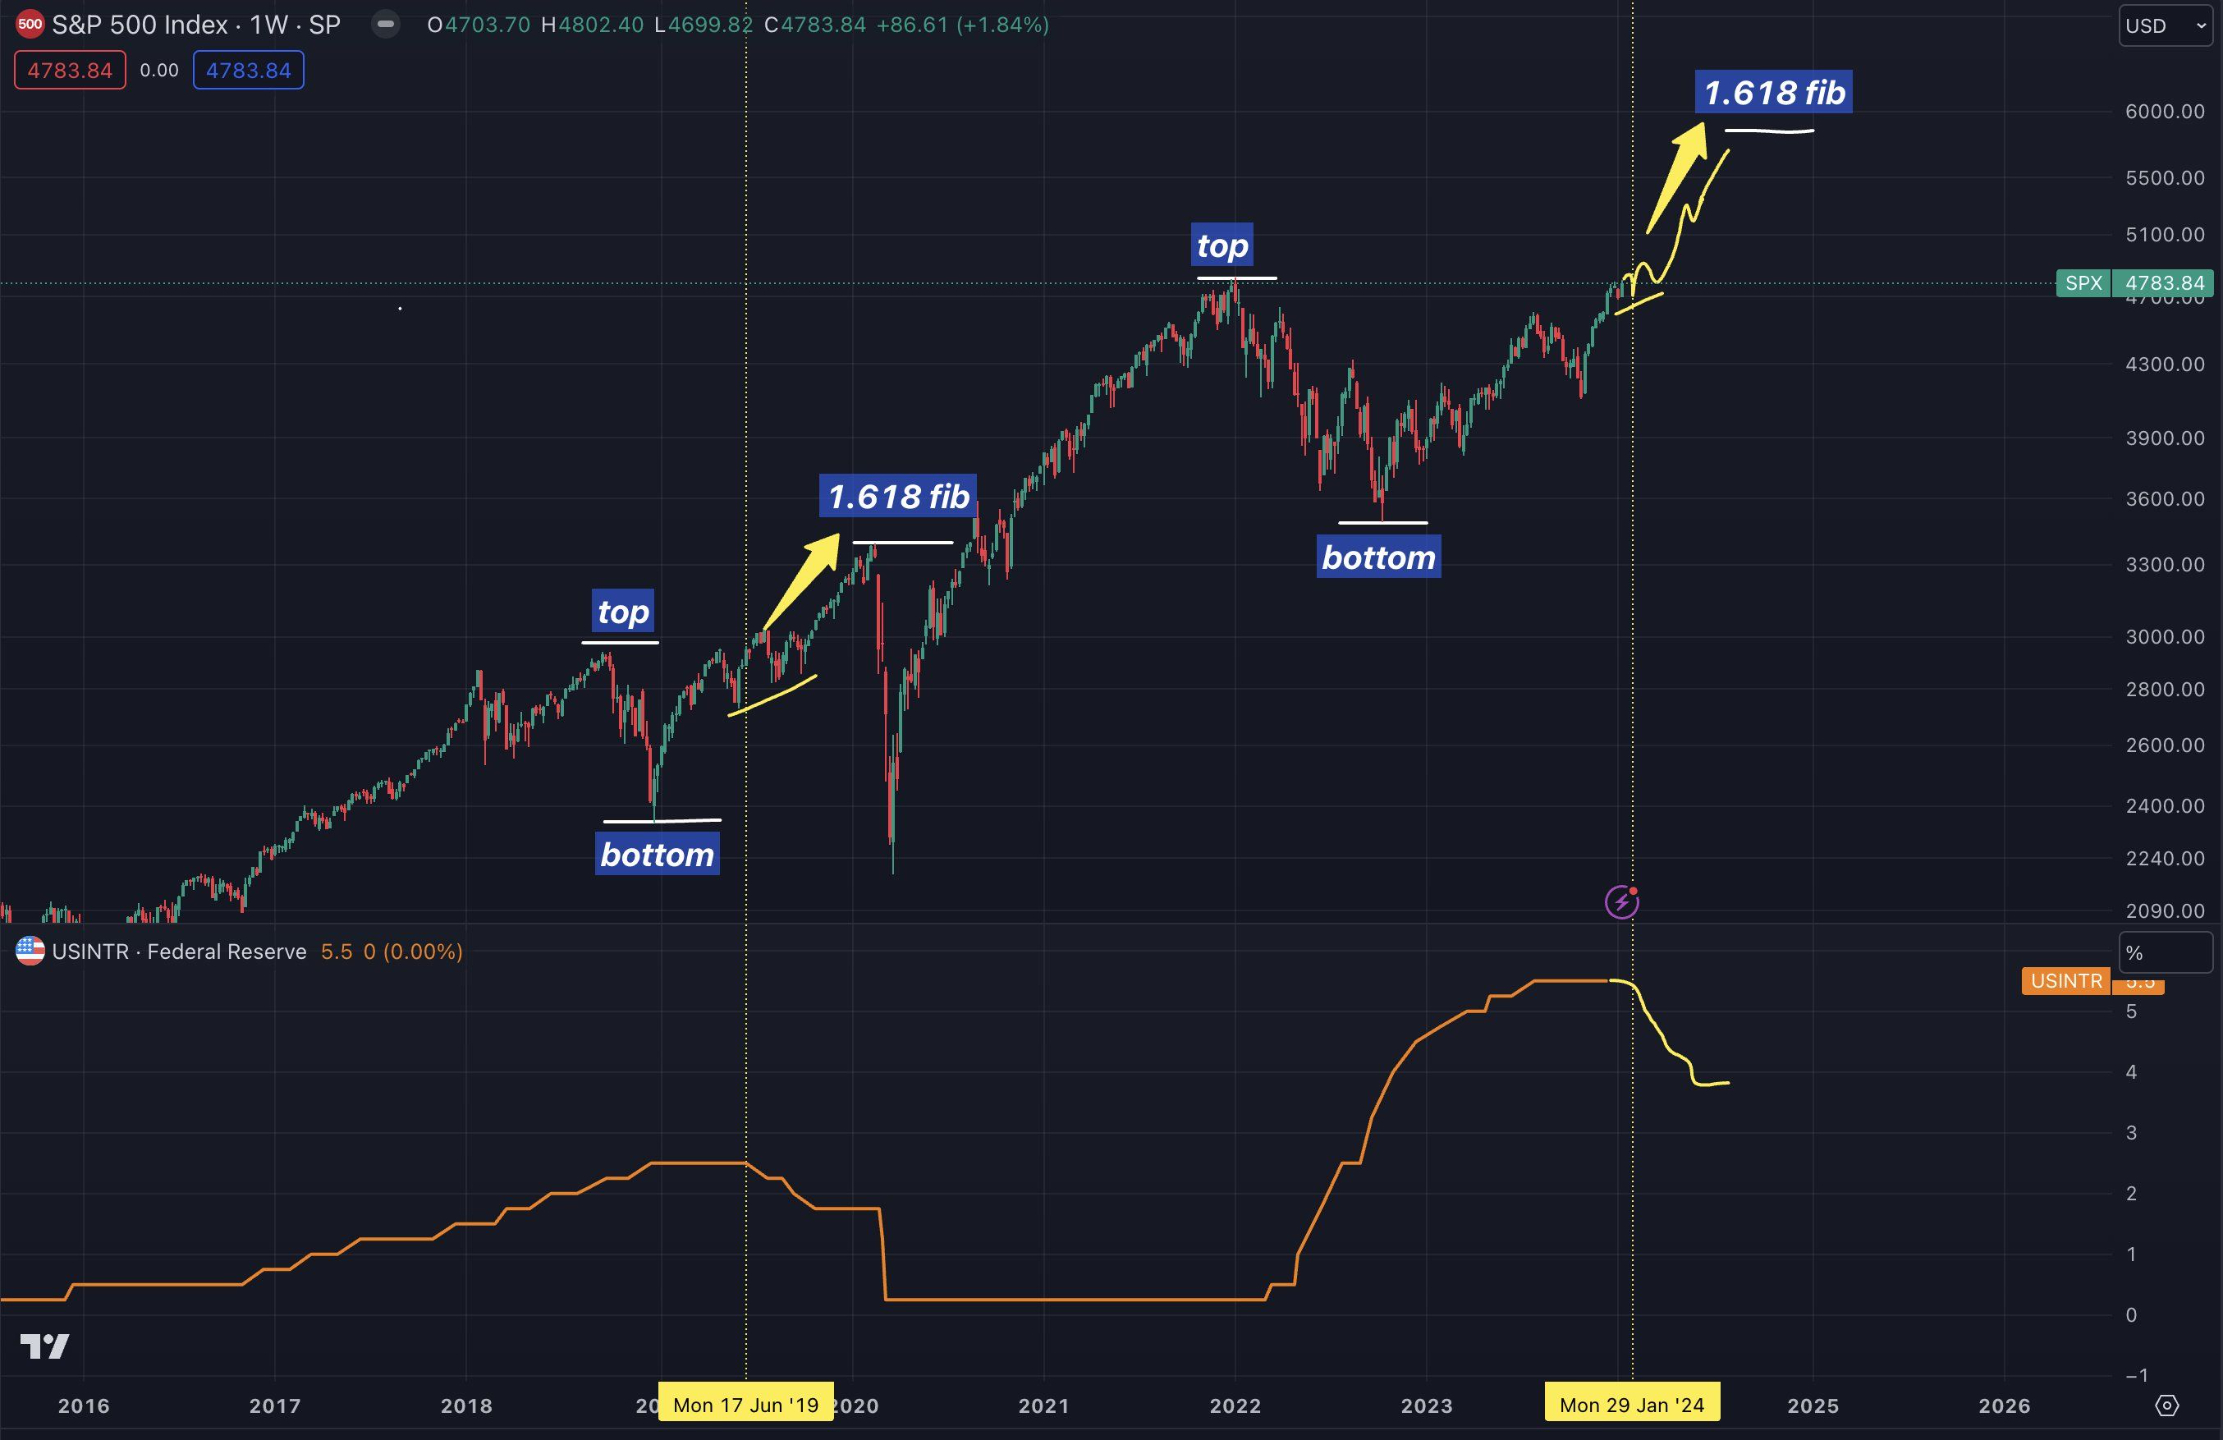
Date of Forecast: Early 2024
Details: "Predicted a strong market rally into euphoria followed by a significant recession. Detailed analysis included FED rates, DXY, bonds, and Bitcoin performance."
Outcome: "As forecasted, the S&P 500 reached new all-time highs before experiencing a sharp downturn, while Bitcoin followed a similar trajectory, peaking and then correcting."
Record #4
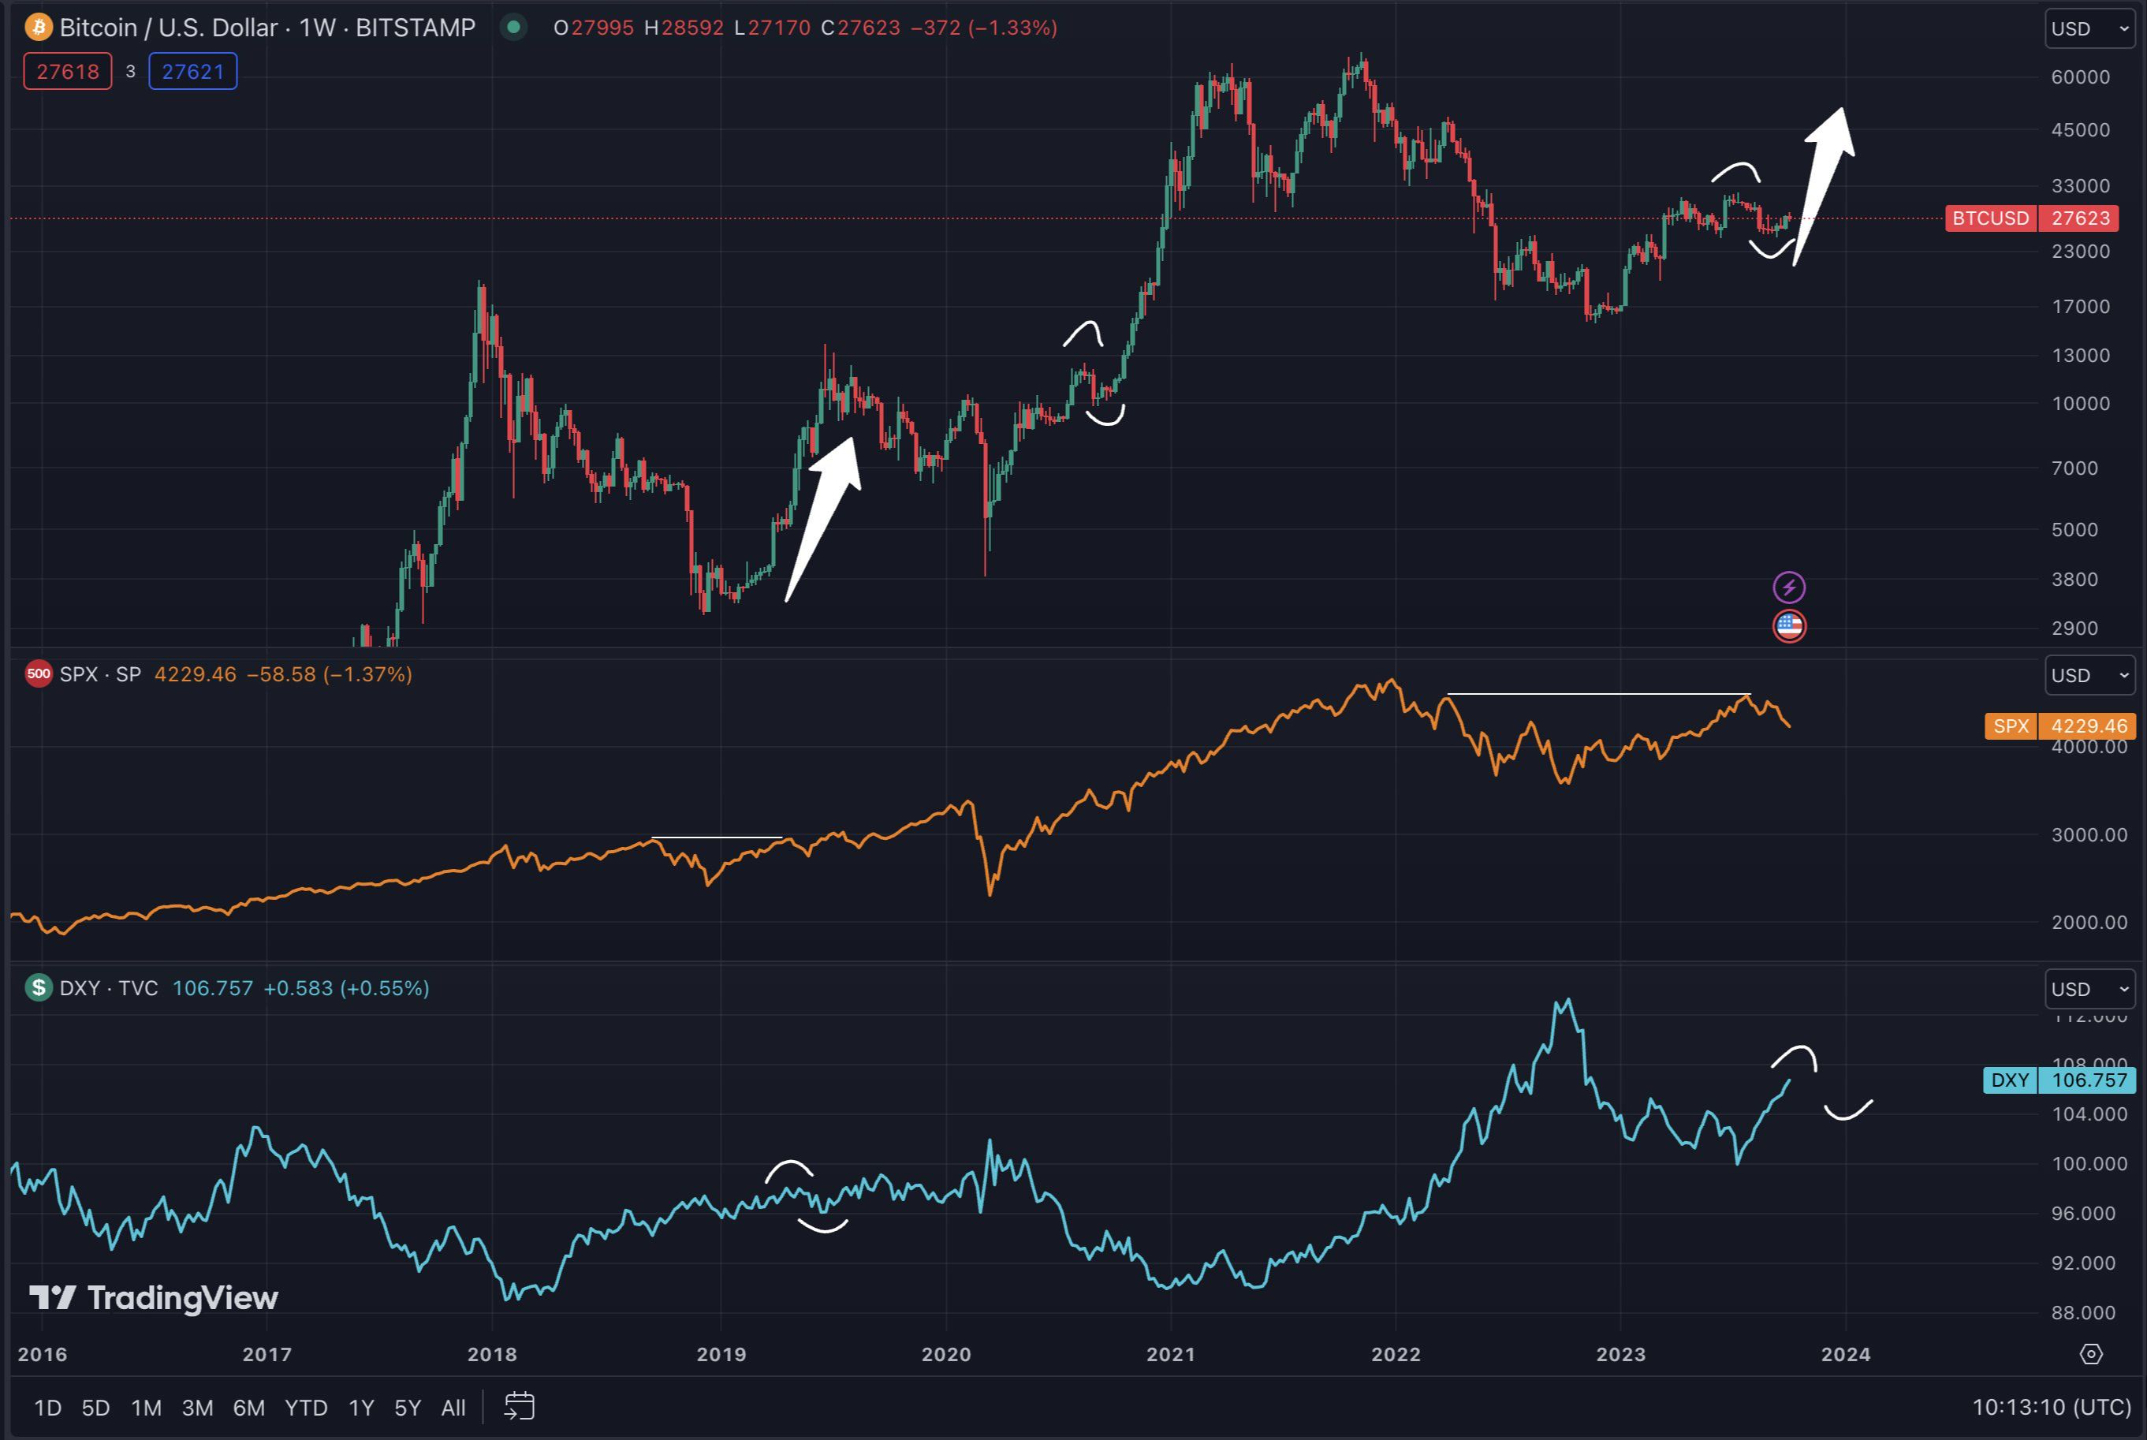
Date of Forecast: October 2023
Details: "Predicted that Bitcoin would follow similar patterns observed in the SPX and DXY charts from March 2019 and September 2020, preparing for a significant move."
Outcome: "Bitcoin followed the anticipated trajectory, demonstrating the accuracy of our comparative analysis with the SPX and DXY."
Tools & Data
See what we follow in real-time (data and stats).

US Unemployment Rate

US Consumer Price Index (CPI)

10-Year Treasury Yield

US 3-Month Treasury Yield

Federal Reserve Balance Sheet (Total Assets)

Our Final Theory for the Next Decade
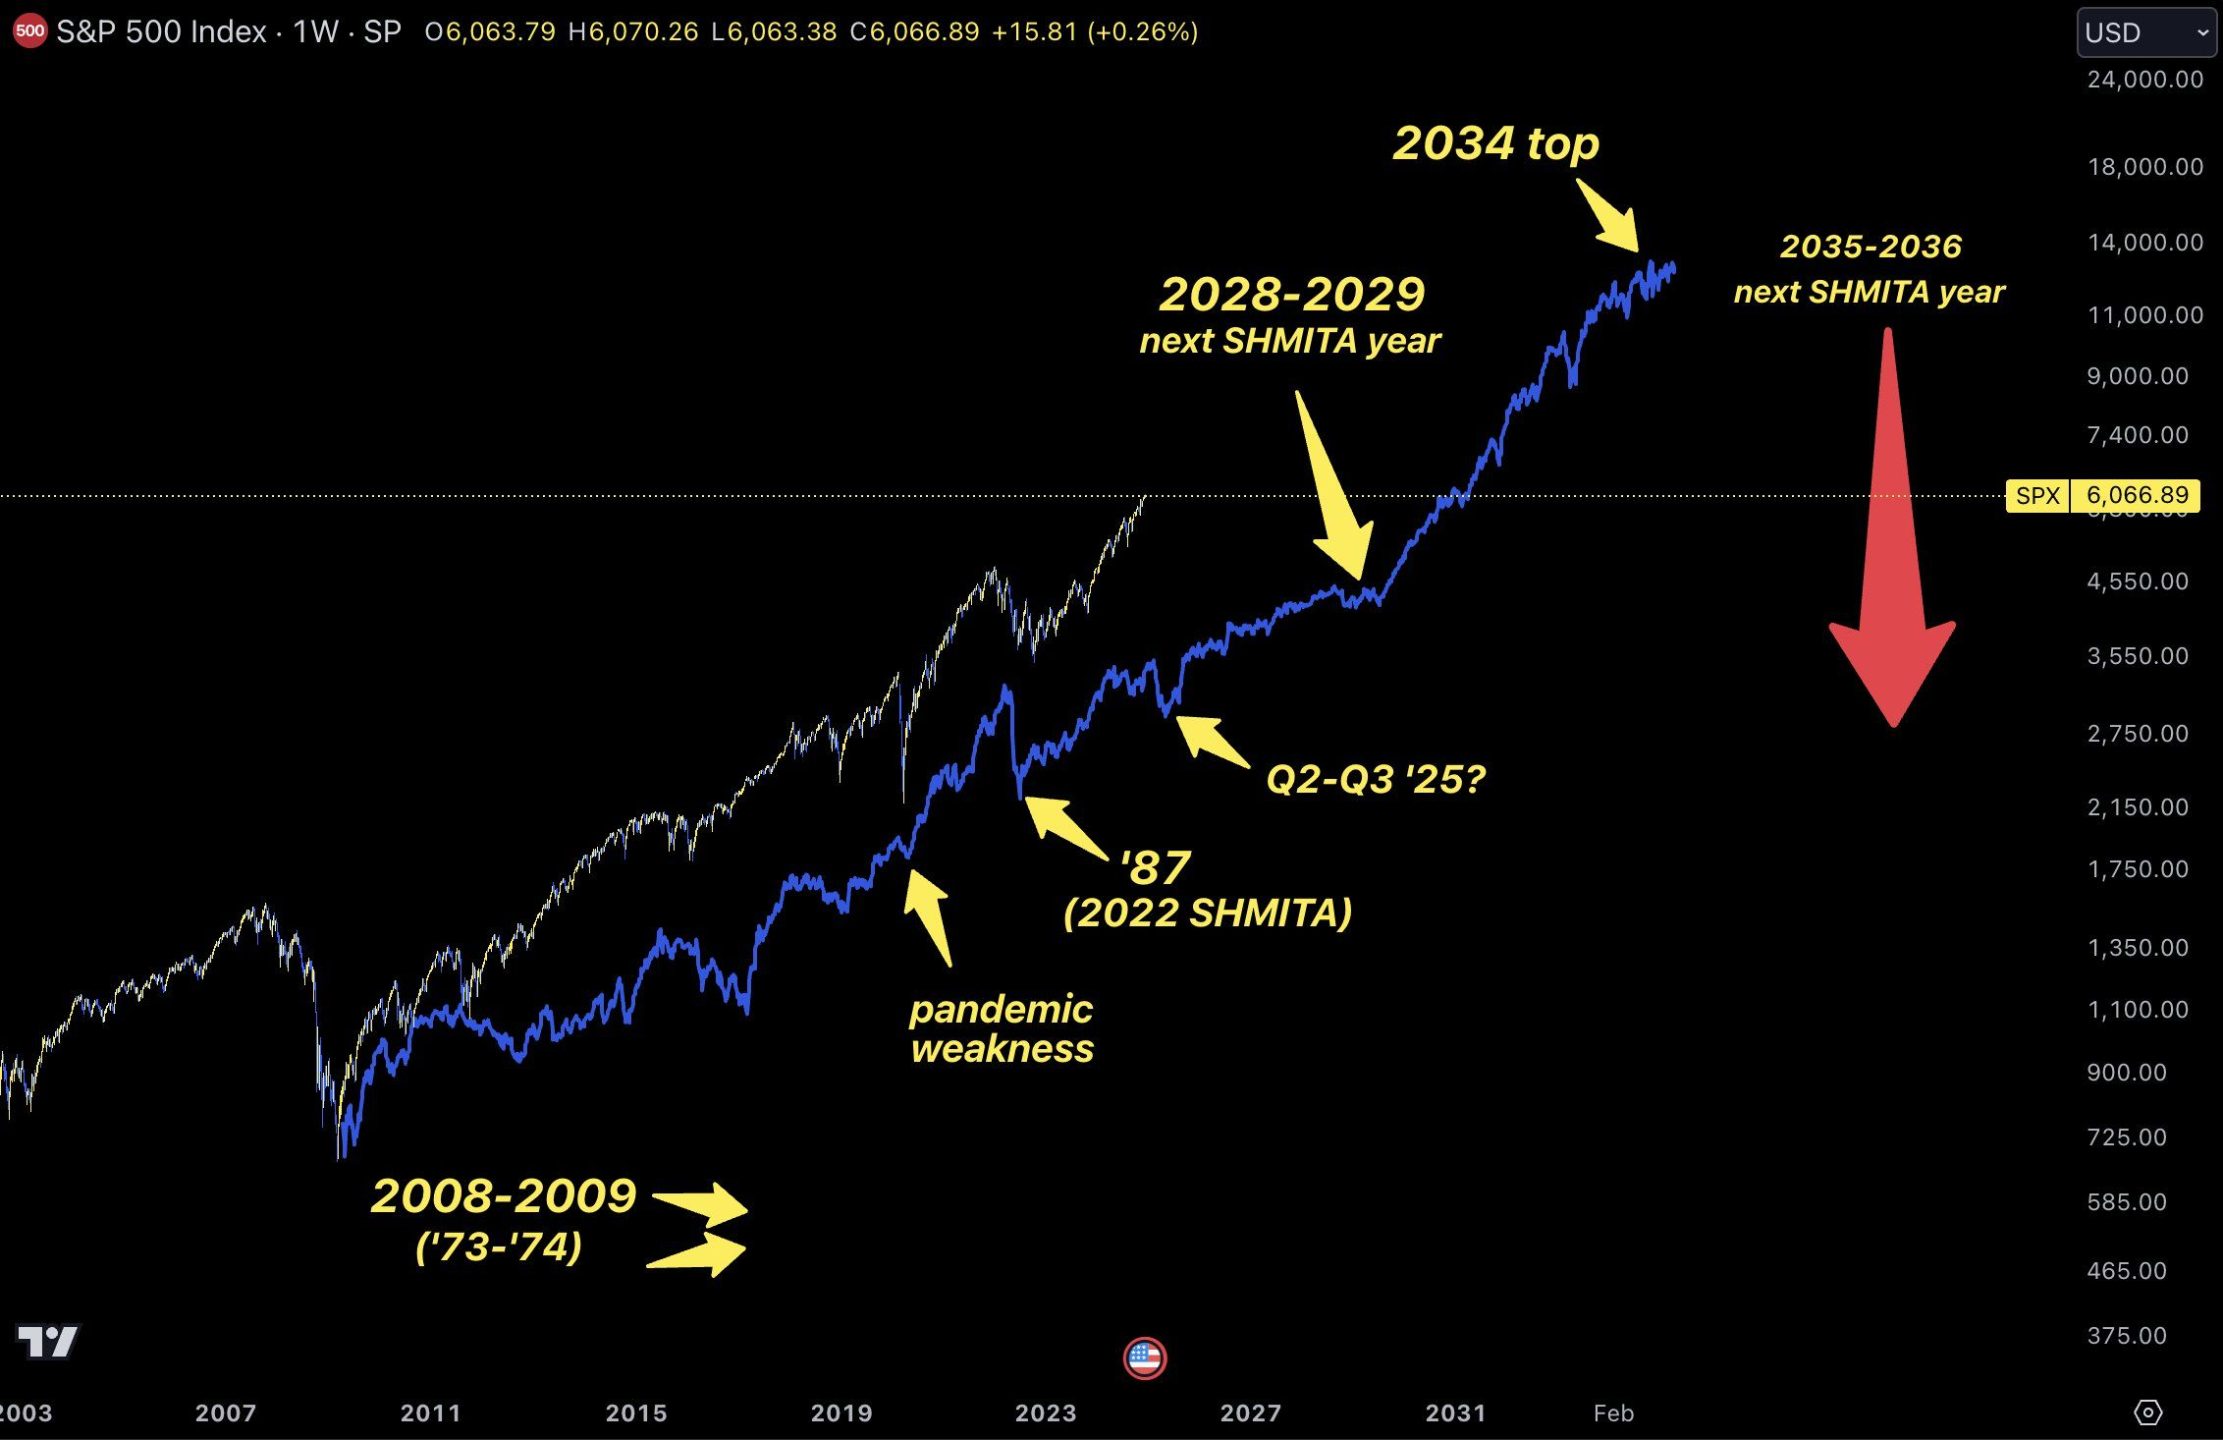
Key Components of the Chart
- The Blue Line: A Fractal from 1974 to 2000
- The blue line overlays a fractal pattern derived from the S&P 500’s behavior between 1974 and 2000, a period marked by rapid growth and periodic corrections. This fractal is used as a predictive tool, suggesting that the market may follow a similar path in the coming years.
- Why 1974-2000? This timeframe spans significant market developments, including recovery from the 1973-1974 recession, the 1987 crash, and the tech boom of the late 1990s. The fractal reflects recurring cycles of expansion and contraction that may echo in current and future trends.
Historical Insights: What the Past Tells Us
-
2008-2009 (’73-’74 Recession):
- The 2008-2009 financial crisis was one of the most severe downturns in modern history, triggered by the housing market collapse. It mirrors the earlier recession of 1973-1974, highlighting the market’s cyclical nature.
-
1987 Market Crash (‘Black Monday’):
- Marked on the chart alongside the 2022 Shmita year, this event reflects a sudden, sharp correction. The Shmita connection emphasizes that similar cyclical forces might be at play in both years.
-
Pandemic Weakness (2020):
- The market's sharp decline during the COVID-19 pandemic illustrates its vulnerability to external shocks. However, its rapid recovery also underscores resilience, bolstered by government intervention and monetary policies.
Future Projections: What Could Lie Ahead?
-
Q2-Q3 2025: A Potential Correction?
- The chart speculates a possible market pullback in the second to third quarter of 2025, aligning with historical correction patterns. This serves as a reminder to remain cautious and adaptable during this period.
-
2028-2029: The Next Shmita Year
- The next Shmita cycle in 2028-2029 could bring heightened market volatility or even a correction. Investors are encouraged to prepare for potential disruptions during this timeframe, as history shows that Shmita years often coincide with economic or market stress.
-
2034: A Market Peak?
- A potential market top is projected for 2034, suggesting a culmination of a period of strong growth. This could represent a high point for investors to capitalize on before a downturn.
-
2035-2036: A Major Correction?
- The bold red arrow points to a significant possible downturn in 2035-2036, coinciding with another Shmita year. This reinforces the recurring nature of cycles and the need for strategic planning.
The Role of the Shmita Cycle
The Shmita cycle is rooted in ancient biblical tradition, where every seventh year was marked as a sabbatical year for rest and debt forgiveness. In financial markets, analysts have identified correlations between this cycle and periods of significant disruption, including:
- 2008 financial crisis
- 2001 dot-com bubble
- 1987 crash
The Shmita cycle is not a guarantee of market behavior but offers a framework for understanding recurring economic patterns.
How to Use This Information
-
Recognize Fractal Patterns:
- The blue fractal line (1974-2000) provides a reference for how markets may behave in the future, reflecting past cycles of growth, correction, and recovery.
-
Anticipate Cycles:
- The Shmita cycle and the chart’s projections for 2025, 2028-2029, and 2035-2036 suggest that markets could see turbulence during these periods. Preparing for these potential corrections can help mitigate risks.
-
Maximize Growth Opportunities:
- The projected 2034 market peak offers a window for investors to position themselves for potential gains during a likely growth phase.
-
Stay Educated and Flexible:
- Markets are dynamic and influenced by a variety of factors. While history provides a guide, staying informed and flexible is essential for navigating uncertainty.
Key Takeaway:
This chart is more than just a snapshot of the S&P 500—it’s a roadmap grounded in historical cycles, fractal analysis, and the Shmita cycle. By understanding these patterns, investors can gain a deeper appreciation of market behavior and strategically position themselves for the opportunities and risks that lie ahead. Whether it’s 2025, 2029, or 2035, this chart offers a powerful tool for anticipating and adapting to the ever-changing financial landscape.
Who is This For?
All Types of Investors, Analysts, and Traders
✅ Long-term Investors: Individuals planning their financial future and looking for comprehensive, decade-long market forecasts.
✅ Market Analysts: Professionals who need accurate forecasts to support their market analyses.
✅ Traders: Day traders, swing traders, and those looking for detailed market movements to inform their trading strategies.
✅ Bitcoin and Cryptocurrency Investors: Whether you’re a seasoned investor or just starting, if you’re involved in Bitcoin and other cryptocurrencies and need reliable market insights, this is for you.
Who is This Not For?
Get Rich Quick Seekers and Gamblers
❌ Get Rich Quick Seekers: If you’re looking for overnight success without understanding market fundamentals, this isn’t for you.
❌ Gambling Mindset: Those who treat investing as a gamble rather than a calculated decision based on market insights and data.
❌ Impatient Investors: If you lack the patience for thorough analysis and long-term strategies, this platform may not suit you.
❌ Unwilling to Learn: Individuals who are not open to understanding market dynamics and prefer not to engage with detailed analyses and forecasts.
Join The Game Of Liquidity
Find out what market plays you must make in order to profit AND stay safe in the next decade.
Membership renews automatically.
Cancel any time - Risk Free.
OG STATUS
After your first 6 months in Game Of Liquidity Premium, you become an OG.
You’ll receive a special badge on Discord, and your subscription will be discounted by 20% FOR LIFE.
Frequently Asked Questions
Here are the most frequently asked questions and answers.
What do I get with my subscription to the weekly market updates?
What if I don’t have a lot of experience with macroeconomics?
What makes your predictions different from others?
Is it worth it if I only invest occasionally?
Do you cover other markets besides crypto?
How do I access the weekly updates?
What if I miss a weekly update?
Can I cancel my subscription at any time?
Still have questions? Reach out to us anytime.
Email Us At contact@gameofliquidity.com